How to interpret an event satisfaction score
An average rating can hide two very different events. Five people choosing 4/5 is unlike a mix of delighted and dissatisfied guests that happens to average 4/5. Use this worksheet to report the exact question, every rating count and who answered before deciding what the score means. A universal 'good score' benchmark cannot tell you how your own audience experienced the event.
Boletolibre editorial team
Published
Download the satisfaction-score worksheet
Download the editable analysis sheet (Markdown, English)
Use one row per question and event edition. Record the exact wording, the scale anchors, collection channel, eligible audience, invitations delivered and complete ratings. A one-to-five overall-satisfaction question measures something different from a zero-to-ten recommendation/NPS question; keep the series separate. The downloadable sheet includes a rating distribution, arithmetic example and action log.[1]
Calculate the number, then reveal the distribution
| Measure | Calculation | What it leaves out |
|---|---|---|
| Mean rating | Sum of all valid rating values ÷ number of complete ratings | How many chose each value |
| Rating distribution | Count and share for every response option | Why respondents chose it |
| Response coverage | Responses ÷ delivered invitations, where a defensible denominator exists | How nonrespondents felt |
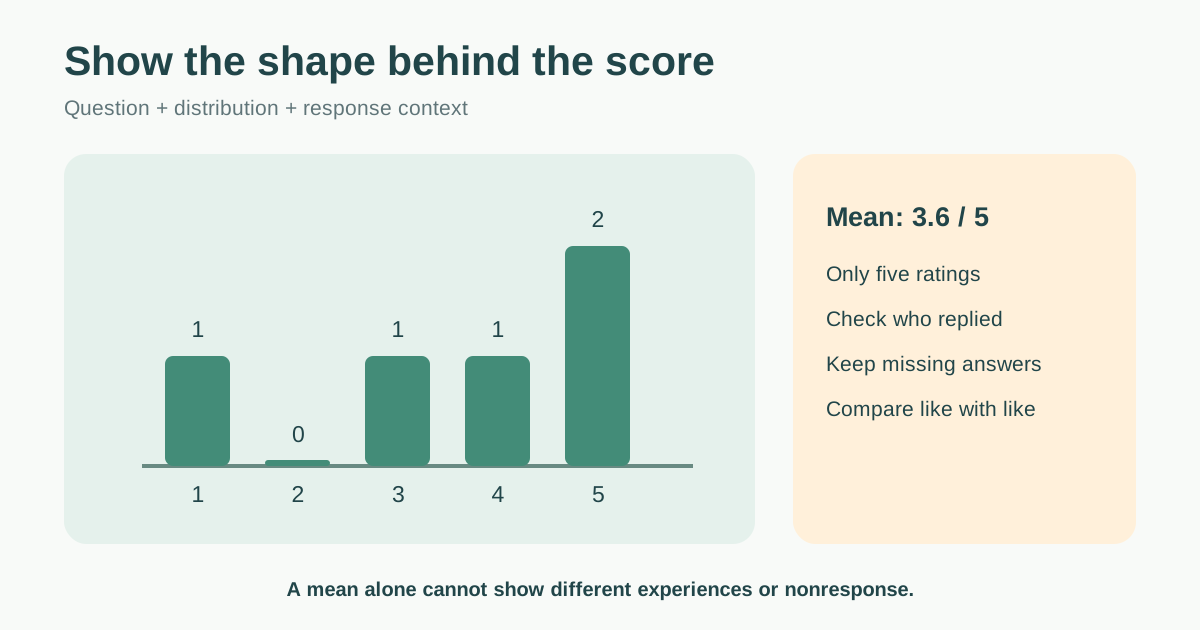
For five complete ratings of 1, 3, 4, 5 and 5, the mean is 3.6/5. The two 5s do not erase the 1. State the count and show missing or skipped answers separately; do not convert 3.6/5 into '72% of guests satisfied.' Decide in advance whether a rating of 4 or 5 counts as a favorable response if you report that share.
Ask who did not answer
A satisfaction score from voluntary respondents describes those respondents. People with unusually positive or negative experiences may be more motivated to reply, and an open QR-code link may not even provide a defensible invitation denominator. AAPOR recommends reporting response rates but cautions that the rate alone does not establish survey quality. Pew defines nonresponse bias as the possibility that respondents differ systematically from people who do not respond. The relevance to this event is a risk to examine, not a numerical correction that can be guessed.[2][3]
Compare the respondent mix with the attendee mix only for characteristics collected appropriately and reported in groups large enough to protect privacy. Check whether the invitation reached everyone intended, whether duplicate responses were possible and whether survey language or accessibility excluded some attendees. Record these limitations beside the chart.
Compare only like with like
A change from 4.1 to 4.3 can reflect a real change, a different question, a different audience or a different response pattern. Keep the wording, scale, invitation timing and eligibility stable where possible. Show sample counts and the distribution for each edition, and describe any meaningful differences before claiming improvement. Avoid a universal 'good' threshold or an unsupported industry benchmark from a vendor blog.
Do not treat a small subgroup's average as a reliable ranking of speakers or sessions. Open comments provide context and possible explanations, not a vote from the full audience. Check themes against support logs, access requests, incident reports and staff observations before assigning an action.
Turn the score into a decision
Select one issue worth investigating, document the evidence and alternative explanations, name an owner and set a review date. For example, a cluster of low navigation ratings plus wayfinding complaints warrants a route review; the overall mean alone does not tell you where a sign should go. Share a concise report with the question, dates, counts, distribution, coverage, caveats and chosen action.
Do not promise that a high satisfaction rating proves return on investment or predicts ticket sales. Measure those outcomes separately. The value of the score is a repeatable, transparent signal that helps the team ask better questions.
Sources and further reading
- What is event satisfaction score?Eventhost · Accessed
- Response Rate OverviewAAPOR · Accessed
- What Low Response Rates Mean for Telephone SurveysPew Research Center · Accessed