Track event ticket sales pace with a simple decision sheet
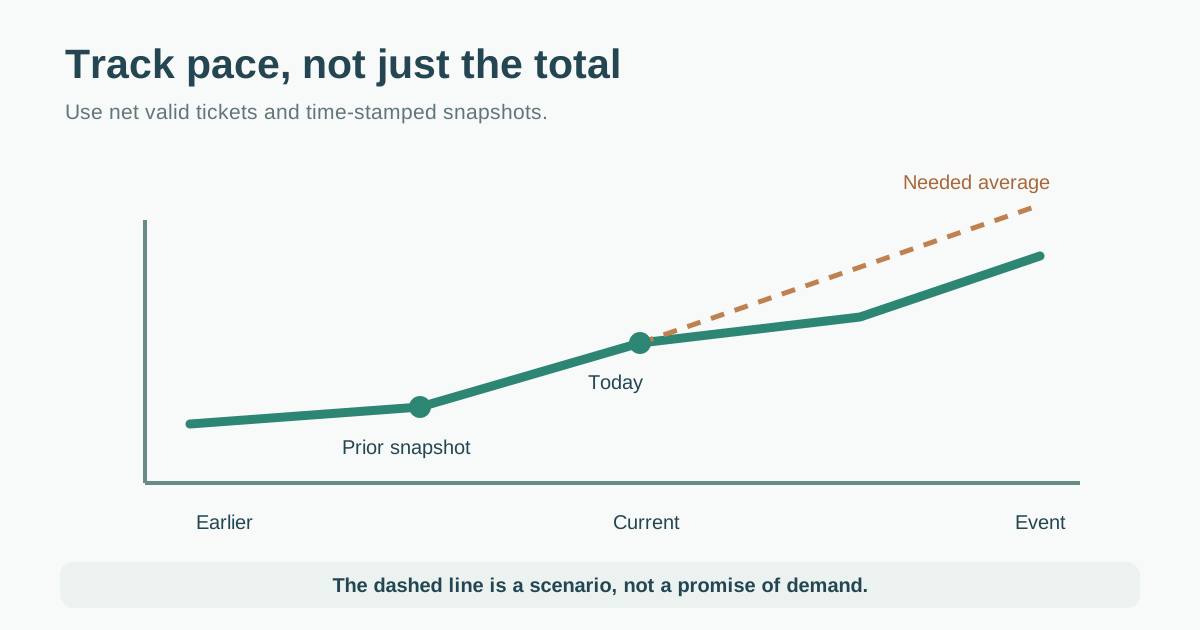
“Two hundred tickets sold” means little without capacity, days left and the sales history. The first organic Google result recommends tracking sales velocity from cumulative tickets, and the next result offers an interactive diagnostic. This focused worksheet lets an organizer record net valid tickets at consistent snapshots, compare them with remaining inventory and note what changed. The required average pace is a planning calculation, not a prediction that demand will follow a straight line.
Boletolibre editorial team
Published
Download the ticket sales pace worksheet
Download the editable sales pace sheet (Markdown, English)
Record the same event and ticket tiers at each snapshot: on-sale date, net valid tickets, gross sales, refunds/voids, complimentary admissions and current saleable capacity. The sheet calculates net change between two snapshots and a simple remaining-capacity scenario. Tickera’s leading guide suggests comparing cumulative counts over time; this version makes the ticket-status definitions explicit so a refund or comp does not silently look like paid demand.[1]
Choose one authoritative sales source
Use the ticketing system’s order and ticket status as the source of truth. Count confirmed valid tickets, not page views, carts or payment attempts. State whether your measure includes free RSVPs, comps, group allocations and transfers. A refunded order can lower the net count after an earlier snapshot; keep gross issued and net valid separate. Eventbrite documents sales quantity/gross/net views by period and ticket type, and a sales-over-time report that includes refunds and multiple currencies. These are Eventbrite capabilities, not assumptions about every platform.[2][3]
If two platforms sell the same event, reconcile duplicates and timezones before adding their totals. Save the report date and extraction owner. Changes in saleable capacity, held allocations or tier closures should be logged beside the count.
Calculate observed and needed pace carefully
| Measure | Calculation | Meaning |
|---|---|---|
| Observed net pace | (Net valid tickets now − net valid tickets at prior snapshot) / elapsed days | Net tickets gained per day in this window; can be negative |
| Remaining saleable inventory | Current saleable capacity − net valid tickets | Space available under your current definition |
| Simple needed average | Remaining target tickets / days left in sales window | Arithmetic scenario, not forecast |
| Same-point comparison | Current net sold vs comparable prior edition at same days-to-event | Context if event and inventory are genuinely comparable |
Suppose 320 net valid tickets were recorded seven days ago and 390 today: the observed net pace is 10 tickets per day. If the *approved sales target* is 600 with 21 selling days left, the simple needed average is 10 per day. This says the arithmetic matches today’s target; it does not prove the event will sell at that rate. The first organic page describes common launch and final-period surges, but their size and timing vary by event. Use your own history and planned releases instead of a universal curve.[1]
Read the pattern by tier and release
Overall sales can hide a sold-out lower tier or a new release that changes the available mix. Record each tier’s allocation, on-sale status, net valid count and remaining inventory. Compare pace only across windows with comparable offers. A paid campaign, speaker announcement, price change or channel outage may explain a step change; document the event before attributing the result to a tactic. Fast VIP sales alone do not establish that VIP was underpriced.
Do not compare revenue pace with ticket count pace without naming fees, refunds, currency and complimentary tickets. A bundle can produce one order and several tickets. For a multi-day pass, decide whether you are counting passes, admissions or unique buyers before plotting a line.
Turn a slow or fast pace into a question
If the recent pace is below the simple target, first check whether tickets were actually available and checkout was functioning. Then review reach, page clarity, pricing and tier mix with the responsible owner. If pace is high, check fulfillment, venue limits and whether held allocations should remain held. A low number can reflect a planned quiet window; a high number can be driven by one temporary announcement.
Write the next decision and review date in the sheet. Avoid automatic discounting or overbooking based only on a line chart. Inventory and safety limits come from the approved event plan, not a sales formula.
Keep the comparison useful for the next edition
Archive the time-stamped snapshots, status definitions, capacity changes and major announcements. At the next edition compare sales at the same days-to-event and the same stage of ticket releases, noting differences in venue, price and marketing mix. Treat the old curve as context, not a guaranteed forecast.
Sources and further reading
- Ticket Sales Metrics: The Numbers Every Event Organizer Should TrackTickera · Accessed
- How to use the Analytics toolEventbrite Help Center · Accessed
- Download a Sales over time report for your eventsEventbrite Help Centre · Accessed