Website uptime target calculator for event registration windows
An uptime percentage means little until you name the time window and the attendee task. A public event page may remain reachable while registration or a hosted checkout fails. Use the editable calculator to turn your own proposed target into an outage-minute allowance for the main site and a separate on-sale window. The number is a planning tool, not measured uptime or a promise from a provider.
Boletolibre editorial team
Published
Download the editable calculator
Download the availability target calculator (Excel)
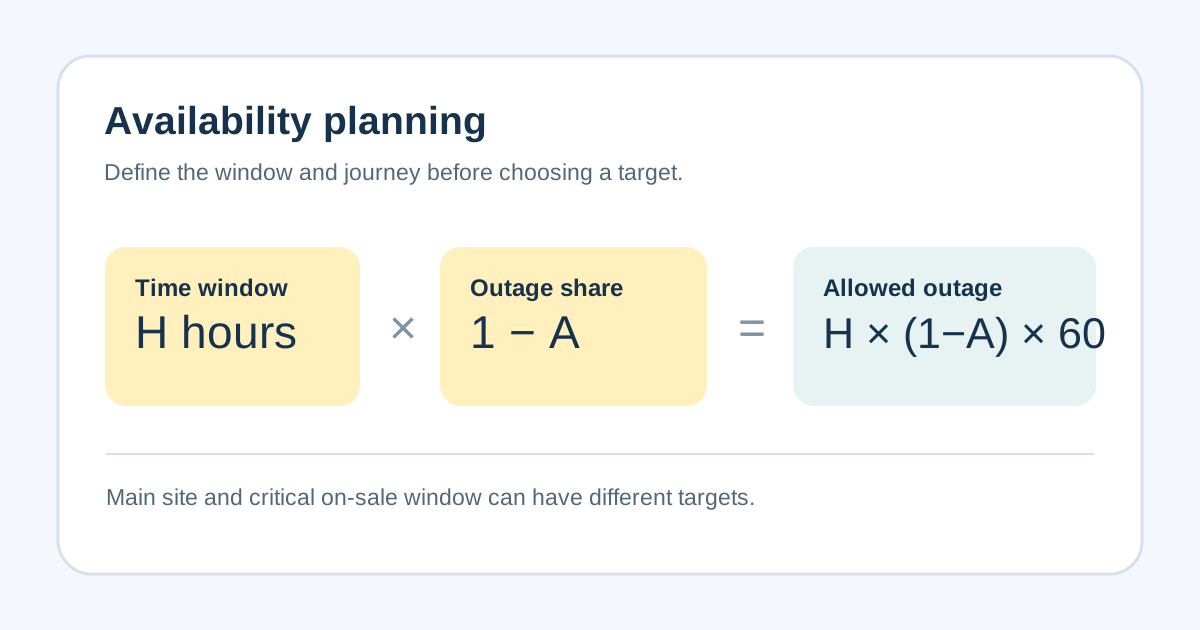
Enter hours and an availability percentage in the yellow cells. The workbook calculates allowed unavailability in minutes as (1 − target) × hours × 60. Leave an input blank and the result stays blank; a non-positive window or percentage outside 0–100% asks you to check the inputs.
The second row is for a critical ticket on-sale window. Its target and duration can differ from the ordinary site window. Record the monitored journey, excluded services, owner and evidence beside each calculation. The workbook contains no preset target because the organizer must choose one that matches actual attendee needs and operating capacity.
Choose the visitor journey before the percentage
Decide whether “available” means the event page loads, a visitor can submit a registration, or a ticket purchase can complete. Name the start and end of that journey, the regions checked and the failure condition. A home-page ping cannot by itself prove that an external checkout or confirmation email works.
If you use Boletolibre.com for your event information, include the page your attendees actually use in the monitoring scope. Document any ticketing, payment or email provider as a separate dependency unless your check truly exercises that step.
Use the same time interval for the target and calculation
For a continuous interval, enter its real number of hours. For a short on-sale, enter only that window, including the correct time zone in your operational record. An identical percentage creates a much smaller minute allowance in a four-hour launch than across a month. Do not compare those allowances without naming the periods.
The calculation is a time-based planning approximation. A request-based service-level indicator instead counts good requests over total requests; its error budget is a count, not necessarily outage minutes. Google SRE recommends specifying what the indicator measures and how it is implemented before using the objective for decisions.[1]
Keep objectives, measurement and contracts separate
An SLO is an internal objective for a defined service and measurement; an SLA is a contractual commitment with its own scope and consequences. A hosting or payment provider’s SLA does not automatically cover the entire attendee journey. Read each provider’s actual terms and record what is excluded.[1]
After the window, compare observed data with the objective and review incidents that affected attendees. Amazon CloudWatch describes SLOs in terms of a selected indicator, goal and interval; this spreadsheet provides only the goal arithmetic. It does not collect evidence, monitor the site or determine contract credits.[2]
Turn the target into an actionable handoff
Give one person ownership of each journey, its monitor and the response route. Agree what should happen if registration is unavailable during an on-sale: who checks the provider boundary, who updates the public status channel and who decides whether to pause promotion. Keep the recovery procedure in the incident plan, not in the calculator.
Review the target after launches and real incidents. If the monitor misses a failure that attendees reported, improve its coverage before increasing the percentage. If the target is repeatedly missed, inspect the dependency and recovery path rather than changing the denominator to make the report look green.
Sources and further reading
- Implementing SLOsGoogle SRE Workbook · Accessed
- Service level objectives (SLOs)Amazon CloudWatch Documentation · Accessed