Mobile event website performance testing checklist
An event page can look fast on an office laptop yet feel unusable to a visitor opening a ticket link on a crowded train. BrowserStack’s performance checklist recommends defining goals, realistic scenarios, a controlled environment, results and retesting. This event-specific version keeps the same useful sequence but tests one mobile attendee journey at a time. It does not ask you to generate peak traffic against a live site; that is a separate, authorized load-test exercise.
Boletolibre editorial team
Published
1. Pick the attendee tasks and success conditions
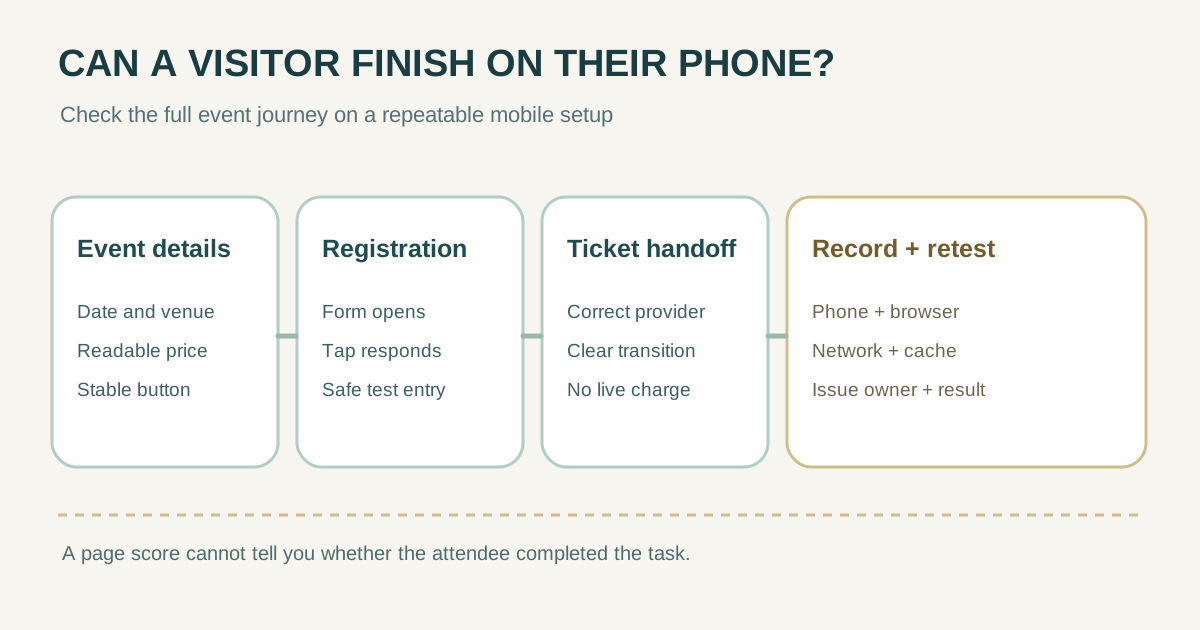
Choose the exact public URLs and the steps a visitor must finish: find the date and venue, open registration, follow the ticket link, and understand the confirmation. Decide which flow is in scope before measuring. A fast homepage cannot make a broken or slow checkout handoff acceptable.
| Journey | What the attendee must see or do | Pass condition to define |
|---|---|---|
| Event landing | Read date, location, price and access details | Facts visible and usable on a narrow phone |
| Registration | Open and complete a safe test form | No confusing wait, lost input or duplicate submission |
| Ticket handoff | Reach the intended ticket provider | Correct destination and clear transition |
| Confirmation | Know whether registration or purchase succeeded | Appropriate test confirmation appears |
The BrowserStack checklist emphasizes realistic scenarios, measurable goals and reviewing results before retesting. Set targets that fit the event and journey; do not copy a vendor benchmark without context.[1]
2. Record a repeatable phone and network setup
- Record test date, page or release version, URL, phone model or emulated viewport, browser and operating system.
- Run a first visit with a fresh cache and, separately, a repeat visit if returning attendees matter. State which one each observation represents.
- Use a representative slower network profile, then repeat with a real phone and actual connection where practical. Keep the profile the same when comparing before and after.
- Use synthetic accounts and a safe registration or ticket-provider test path; do not create a real charge or contact an attendee.
Chrome DevTools can simulate mobile dimensions and throttle network and CPU, but its CPU slowdown is relative to the computer running it. Treat emulation as a diagnostic approximation, then check a real phone when possible.[3]
| Test record | Fill before measuring |
|---|---|
| URL and build/date | ________ |
| Device or viewport / browser / OS | ________ |
| Network / CPU profile or real connection | ________ |
| Cache state / region / test account | ________ |
| Target for each journey | ________ |
3. Observe the full journey on the phone
- Open the event URL from a fresh tab. Note when the event title and primary image become usable; check that late images or banners do not shift the ticket action.
- Scroll to date, venue, price and accessibility information. Confirm the words stay readable without zooming or waiting for a decorative poster.
- Open registration and interact with the form: focus fields, choose options, submit only a synthetic entry and check the resulting state. Note delayed taps or duplicated actions.
- Follow the ticket link to the external provider. Record where your measurement ends and whether the destination has its own mobile problem. Do not attribute a third-party delay to the event page without evidence.
- Repeat the critical path after a fix using the same setup and record whether the visitor experience actually improved.
Record an observation for each step, not just a total “load time.” If a page score improves but the purchase button remains hidden or slow to respond, the task is still impaired.
4. Read lab and real-user data without mixing them
PageSpeed Insights reports a simulated Lighthouse lab run and, when enough data exists, Chrome User Experience Report field data from real visits. Its field view covers a prior 28-day period and can fall back to origin-level data or show none for a new or low-traffic event page. One lab run cannot establish real-user performance, and old field data may not reflect a change made today.[2]
| Signal | Question it helps answer | Important limit |
|---|---|---|
| Largest Contentful Paint (LCP) | When does the main visible content appear? | Check which element was measured |
| Interaction to Next Paint (INP) | How responsive are real user interactions? | Field data may be unavailable for a new page |
| Cumulative Layout Shift (CLS) | Does visible content jump unexpectedly? | Watch the actual ticket action as well |
| Lab diagnostics | Which resources or scripts delay this run? | Simulated conditions vary from real phones |
Save the mobile report URL or screenshot, run date and whether each number is lab, page-level field or origin-level field. Compare like with like. Use the official PageSpeed categories as reference, then set the team’s own acceptance criteria for ticket launch.[2]
5. Record a fix owner and a comparable retest
| Issue log | Example to replace |
|---|---|
| Journey and step | Ticket link appears late after poster |
| Condition and evidence | Phone / slower network / dated report or screen capture |
| Observed impact | Visitor tapped before link was ready |
| Owner and proposed change | Site owner / reduce hero bytes or defer unrelated embed |
| Retest condition and result | Same phone, network, cache state and URL; pass/fail |
Prioritize issues that block the attendee task, then fix and retest under the same conditions. A slow third-party checkout needs the provider owner in the issue record. A surge of concurrent visitors requires a scoped load test, which is different from this individual-phone check. Store the result with the release notes so the next event can repeat the same test instead of starting from memory.
Sources and further reading
- Performance Testing ChecklistBrowserStack · Accessed
- About PageSpeed InsightsGoogle for Developers · Accessed
- Simulate mobile devices with Device ModeChrome for Developers · Accessed