Event cost per registrant and attendee: editable calculator
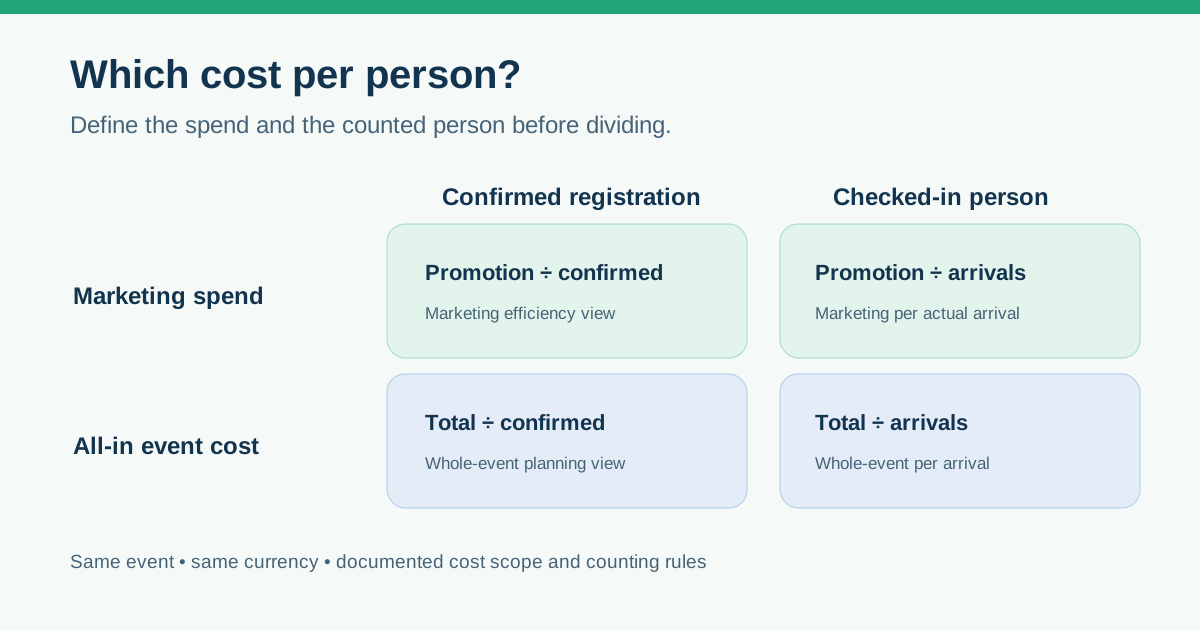
“Cost per attendee” is ambiguous until you name both the cost and the person counted. Did you spend only on promotion or include the entire event? Is the denominator a confirmed registration or someone who actually checked in? This editable calculator shows all four ratios side by side so a planning team can compare like with like without turning one number into a claim about return on investment.
Boletolibre editorial team
Published
Download the event cost calculator
Download the editable calculator (Excel, English)
The workbook opens with clearly labeled illustrative values. Replace the blue input cells with actual spend and counts for one event and one stated currency. Record the export date, source and scope exceptions below the outputs. The formulas show marketing spend and all-in cost per confirmed registration and per checked-in person. The workbook flags a checked-in count above confirmed registrations for manual review; it cannot determine whether your source data is complete.
Choose the cost you mean
For a promotion-efficiency question, use actual marketing spend: paid ads, creative production, campaign localization and other promotion costs you decide to include. Use your itemized marketing budget as the source, but enter actual costs for the measured period rather than the approved estimate. For an all-in event question, add other event expenses such as venue and production to that marketing amount. Do not add the marketing budget again if it is already included in the whole-event ledger.
Write down whether taxes, agency fees, barter, staff time and shared campaign costs are included. A change in scope can move the ratio even when registration performance is unchanged. If multiple currencies appear, convert under a documented finance policy before combining them; a blank currency label does not make unlike amounts comparable.
Count confirmed people and actual arrivals separately
Count unique confirmed registrations under one stated cutoff after removing voids, cancellations and duplicates. Choose whether complimentary tickets, speakers, exhibitors and transfers belong to this population; apply the rule to every comparison period. A registration count is not an attendance count. For checked-in people, use the final door or platform record for the same cohort and event date. Eventbrite’s Check-ins report, for example, includes checked-in tickets, so a different source is needed to establish all registrations.[1]
Walk-ins, guests admitted outside the registration flow, re-entry scans and duplicate scans can make the two counts incomparable. Record them as exceptions rather than quietly adding them to the denominator. If check-ins exceed the confirmed count, inspect the underlying records before using the ratio.
Read the four formulas, not just the lowest figure
Marketing cost per confirmed registration = actual marketing spend ÷ deduplicated confirmed registrations. Marketing cost per checked-in person = the same spend ÷ unique checked-in people from that cohort. All-in cost per confirmed registration = total event cost ÷ confirmed registrations. All-in cost per checked-in person = total event cost ÷ checked-in people. The worksheet leaves a result blank when its denominator is zero; zero attendees does not mean zero cost.
In the workbook’s illustrative example, 2,000 units of marketing spend plus 8,000 other units, 250 confirmed registrations and 180 checked-in people produce 8.00, 11.11, 40.00 and 55.56 units respectively. Those are arithmetic examples, not targets or industry benchmarks.
Keep channel attribution separate from the total
A tagged link can identify campaign traffic. Google Analytics documents source, medium and campaign parameters for this purpose, but a website visit does not by itself prove a confirmed registration, a check-in or causation. A person may move between devices or channels, and hosted checkout can break the reporting path. Keep unattributed registrations visible and avoid assigning every registration to the last clicked ad without a declared model.[2]
If you promote an event page on Boletolibre.com, use a consistent public destination and reconcile final registration and door records before entering totals. This calculator does not assume that any single site’s analytics can observe every attendee journey.
Use the ratio for a decision, not an ROI promise
Compare only events with similar cost scope, registration rules, attendance evidence and currency. A lower cost per confirmed registration can coexist with more no-shows; a higher all-in cost may reflect a different venue, program or access provision. These ratios do not include revenue, contribution margin, attendee value or causal lift. They therefore are not return on investment.
At closeout, save the four outputs with source files and decision notes. Identify one action: revise promotion spend, improve the registration path, address no-shows or refine the next event’s scope. Review that action against the next comparable event instead of adopting an unsupported universal target.
Sources and further reading
- Download your Check-ins reportEventbrite Help Center · Accessed
- URL builders: Collect campaign data with custom URLsGoogle Analytics Help · Accessed