Post-event report template and worked example
A post-event report gives a stakeholder an evidence-based answer to three questions: what happened, how did it compare with the plan, and what should change next time? Download the editable Word template below. It keeps targets, observed results, source dates and limitations together, so an attractive number cannot drift away from what it actually measures. The worked example is fictional; replace it with your event’s verified records.
Boletolibre editorial team
Published
Download the editable post-event report
Download the post-event report template (.docx)
The free, two-page Word file includes event scope, a short executive result, targets versus observed results, measurement definitions, finances, findings, limitations, recommendations and an evidence index. Replace bracketed prompts; delete irrelevant measures and add the outcomes your event was actually meant to achieve. The document is a report for readers, rather than an agenda for a debrief meeting or a task tracker.
A leading template for this search is itself a fill-in post-event report, with event details, summary, financial information, operational issues and recommendations. Providing a usable document matters as much as explaining how to write one. This template adds a source and limitation beside each result to make the conclusions easier to audit.[1]
Gather records and define the reporting cutoff
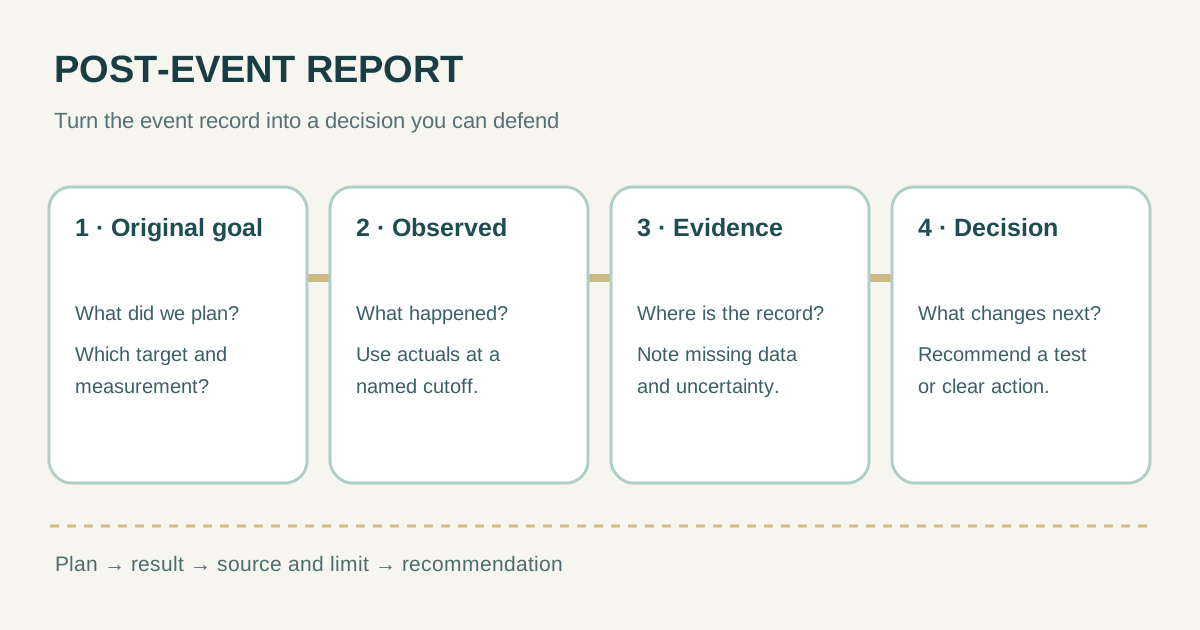
Choose a cutoff date and gather the original goal, registration and check-in exports, ticket and payment reports, invoices, feedback, incident notes and the run of show. Record who supplied each file and when. Late refunds or invoices can change the financial position after the first draft, so mark figures provisional where necessary.
- Registrations are sign-ups; attendance is the people who actually arrived or joined. Explain duplicates, cancellations and repeat scans.
- Gross ticket sales, settled receipts and net income are different. Name the basis and currency before comparing a budget with actuals.
- A survey average needs its question, scale, response count and collection window. A small or self-selected sample is not every attendee’s view.
- If the original plan did not set a target, write ‘target not set’ instead of inventing one after the event.
Whova’s reporting guide recommends comparing outcomes with the event’s original objectives across attendance, engagement and financial measures. Use measures that answer your own objectives; avoid filling a report with metrics merely because a platform exports them.[2]
Worked example: a fictional community workshop
Suppose the plan called for 120 registrations, 90 unique attendees and a break-even net position. At the reporting cutoff, an export records 128 valid registrations, the check-in log records 82 unique attendees, and the payment and cost records show $4,200 revenue and $4,500 costs. The report should say registration exceeded target by eight, attendance missed by eight, and the recorded net position was a $300 loss. Do not say the event ‘caused’ future sales unless you have an appropriate attribution method.
| Measure | Plan | Observed at cutoff | Interpretation |
|---|---|---|---|
| Registrations | 120 | 128 | 8 above plan; export excludes cancellations |
| Unique attendance | 90 | 82 | 8 below plan; 82/128 = 64% of valid registrations |
| Net position | Break even | −$300 | $4,200 recorded revenue less $4,500 recorded costs |
The 64% figure describes this example’s registration-to-attendance ratio; it is not a universal benchmark. If one invoice remains open, state that the net number is provisional. If a survey received only 12 responses, report ‘12 responses’ with the score rather than presenting the score as the opinion of all 82 attendees.
Write findings with evidence and limits
Lead with the result that matters to the reader, then show the supporting number, its source and the uncertainty. For example: ‘Unique attendance was 82 versus a target of 90, based on check-in records through 14 October; unscanned walk-ins are not included.’ A note about an understaffed entrance may explain what staff observed, but it does not prove why eight people were missing.
Separate a documented fact, a plausible interpretation and a recommended experiment. If late arrivals clustered after a transit disruption, describe the timing and the record behind it. To test an earlier start or different reminder next time, specify what you would measure. Keep personal details and raw attendee data in controlled source systems, not in a widely shared report.
End with decisions, not a pile of notes
- State the decision: repeat, revise, resize or discontinue a part of the event.
- Tie each recommendation to one verified observation and name the measure that would test it next time.
- Identify missing evidence, open refunds and costs, and the date on which the report should be refreshed.
- Have the finance and operations owners review the figures and definitions before sharing the report.
A report summarizes the evidence and recommended decisions. Use a separate debrief to discuss competing explanations, then put owners and due dates in an action register. This keeps the report readable while still turning learning into follow-through.
Sources and further reading
- Post-Event Report (PDF)Simon Fraser Student Society · Accessed
- How to Create a Post-Event ReportWhova · Accessed